Your home has a chemistry problem
Indoor air is 2-5x more polluted than outdoor air (EPA). Tap water in 43% of US households exceeds at least one EPA health guideline for contaminant levels. Mold growth begins within 24-48 hours at relative humidity above 60%. These are measurable problems with measurable solutions.
This hub covers home environment science with real numbers: PM2.5 thresholds from WHO and EPA, CADR calculations for room-size-to-purifier matching, filtration method comparison matrices for specific contaminants, humidity-to-mold-risk tables by climate zone, and cleaning product efficacy data with actual contact times and kill rates.
The measurement framework
Every home environment decision reduces to three questions:
| Question | What you need | Tool |
|---|---|---|
| What’s in it? | Contaminant identification and concentration | Test kits, monitors, lab analysis |
| Is the level harmful? | Threshold comparison against standards | WHO, EPA, state-specific guidelines |
| What removes it? | Removal method effectiveness at your concentration | Filtration specs, CADR ratings, contact time data |
Most home environment content skips the second question (jumping from “your water contains X” to “buy this filter”) or answers it with fear instead of thresholds. This hub provides the thresholds.
What this hub covers
Air quality (PM2.5, VOCs, CO2, radon), water quality (heavy metals, PFAS, chlorine, hardness), biological hazards (mold, allergens, dust mites), and cleaning science (disinfectant efficacy, contact times, chemical interactions). Every article includes measurement methods, health-based thresholds, and intervention effectiveness data.
Related across the network
Articles in this guide

Allergen Management at Home — Intervention Efficacy by Allergen Type, Evidence Ratings, and the Hierarchy That Determines What Actually Reduces Symptoms
Intervention efficacy table with evidence rating per allergen type, dust mite control protocols, pet allergen persistence data, mold and pollen management, encasement effectiveness data, and the cost-benefit analysis of allergen reduction strategies.
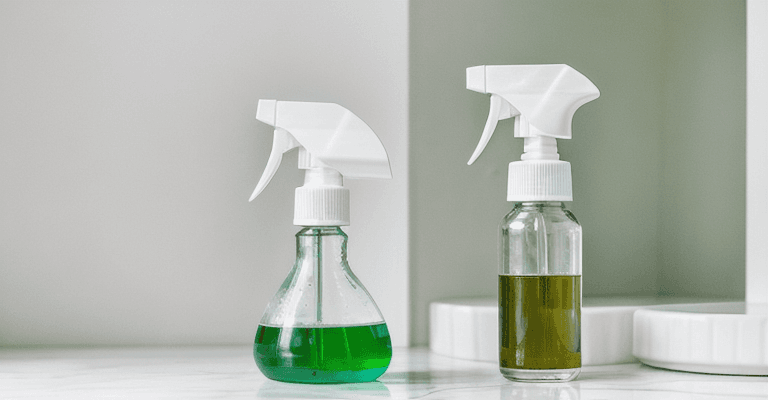
Cleaning Product Efficacy — Contact Time, Dilution Ratios, and the Kill Rates That Separate Disinfection from Wet Wiping
EPA-registered disinfectant contact time table by pathogen type, active ingredient comparison with kill spectra, dilution ratio science, chemical interaction hazards, surface compatibility matrix, and the evidence behind cleaning frequency recommendations.

HEPA Filter Guide — True HEPA vs HEPA-Type, CADR Calculations, and the Air Purifier Math Most Manufacturers Hide
HEPA classification standards with filtration efficiency curves, CADR-to-room-size calculation tables, ACH targets per use case, filter type comparison with lifespan data, and the noise-versus-performance tradeoff that determines real-world air purifier effectiveness.
Indoor Air Quality — PM2.5, VOCs, CO2 Thresholds and the Numbers That Actually Determine Whether Your Air Is Safe
Pollutant threshold comparison across WHO, EPA, and OSHA with health-effect levels per concentration, PM2.5 source identification, VOC category breakdown, CO2 as ventilation proxy, and the measurement methods that separate real data from consumer device noise.
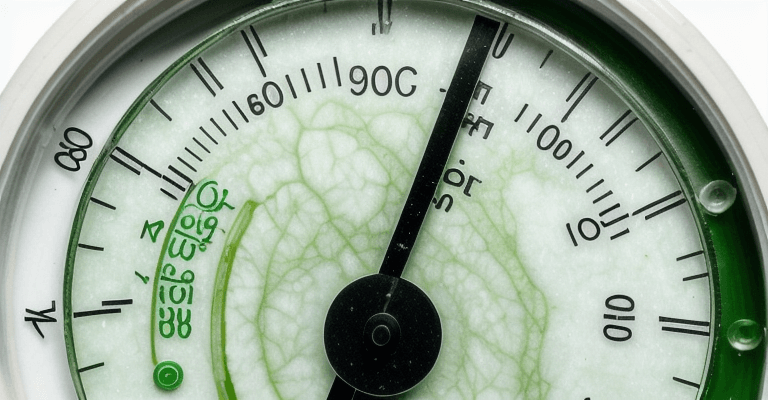
Mold Prevention Science — Humidity Thresholds, Growth Timelines, and the Environmental Conditions That Determine Whether Mold Colonizes Your Home
Humidity-to-mold-risk matrix by room type and climate zone, mold species identification with health effects, growth timeline data, moisture source diagnosis, remediation thresholds, and the measurement protocols that separate actionable data from mold anxiety.
Radon Testing and Mitigation — Action Levels, Testing Methods, and the Cost-Effectiveness Math for the Second Leading Cause of Lung Cancer
EPA and WHO action level decision table, testing method comparison with accuracy data, mitigation system types and cost, radon entry pathway diagnosis, geographic risk data, and the lung cancer risk quantification per concentration level.
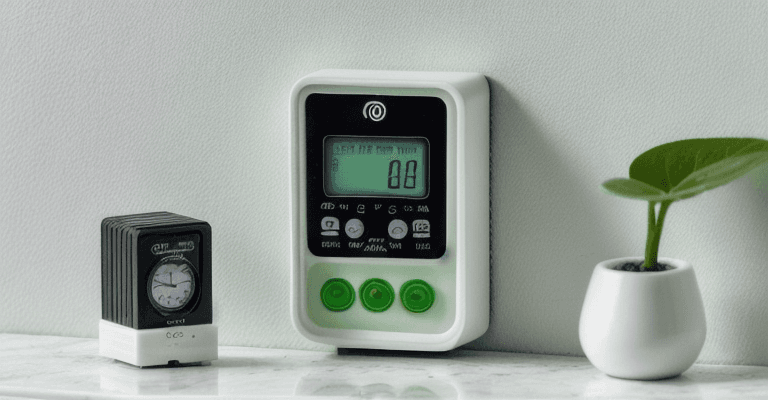
Smart Home Air Monitoring — Sensor Accuracy, Consumer vs Reference Instruments, and What Your Air Quality Monitor Actually Measures
Sensor technology comparison between consumer and reference-grade instruments, accuracy data per pollutant type, calibration drift timelines, monitor feature comparison matrix, and the interpretation framework that separates actionable data from expensive noise.

What's in Your Tap Water — Chlorine, Lead, PFAS, and the MCL Table That Shows Where EPA Limits End and Health Risk Begins
EPA maximum contaminant level table compared to actual detected levels, health-based goals versus enforceable limits, PFAS emerging regulation, lead service line prevalence, chlorination byproduct data, and the gap between legal compliance and health-optimal water quality.
Ventilation Rate Guide — ACH Requirements, CO2 as Proxy, and the Airflow Calculations That Determine Whether Your Home Is Under-Ventilated
ACH requirement table by room type with CO2 thresholds, ventilation system comparison, natural versus mechanical ventilation effectiveness, energy-recovery ventilator selection, and the calculation framework for matching ventilation to occupancy and pollutant load.
Water Filtration Systems Compared — Contaminant Removal Matrix, Filter Lifespan, and What Each Technology Actually Removes
Filtration method comparison across 20 contaminants with removal percentages, NSF certification standards, filter lifespan data, cost-per-gallon analysis, and the contaminant-specific decision framework for choosing the right system.