Food Preservatives Ranked by Safety Evidence — From Citric Acid to BHA
Evidence-based safety tier ranking of common food preservatives with CAS numbers, Acceptable Daily Intake values, effectiveness matrices by food type, natural vs synthetic comparison, and EU/US/SG regulatory status.
The dose makes the poison — but which doses, exactly?
Every food preservative has an Acceptable Daily Intake (ADI) established by regulatory bodies like the European Food Safety Authority (EFSA) and the Joint FAO/WHO Expert Committee on Food Additives (JECFA). The ADI represents the amount of a substance that can be consumed daily over a lifetime without appreciable health risk, expressed in milligrams per kilogram of body weight per day (mg/kg bw/day).
The ADI is not a cliff edge. Exceeding it on a single day does not cause harm. It is a chronic exposure threshold calculated by taking the No Observed Adverse Effect Level (NOAEL) from animal studies and dividing by a safety factor — typically 100 (10x for species extrapolation, 10x for individual human variation). This means the ADI already has a hundredfold safety margin built in.
What matters is your habitual intake pattern. A 70 kg adult with an ADI of 5 mg/kg bw/day can consume 350 mg daily for their entire life with no expected adverse effect. The question for each preservative is: does typical dietary exposure approach that threshold?
Preservative safety tier table
This ranking is based on weight of evidence from EFSA re-evaluations (2015-2025), FDA GRAS determinations, JECFA assessments, and published systematic reviews. “Safety tier” reflects the consensus position across major regulatory bodies, not any single study.
| Tier | Preservative | E-Number | CAS Number | ADI (mg/kg bw/day) | Mechanism of Action | Evidence Quality |
|---|---|---|---|---|---|---|
| 1 — Well-Established Safe | Citric acid | E330 | 77-92-9 | Not specified | pH reduction; chelation of metal ions | High |
| 1 | Ascorbic acid (Vitamin C) | E300 | 50-81-7 | Not specified | Oxygen scavenging; free radical termination | High |
| 1 | Tocopherols (Vitamin E) | E306-E309 | 59-02-9 | 2.0 (synthetic dl-alpha) | Lipid peroxidation chain termination | High |
| 1 | Acetic acid | E260 | 64-19-7 | Not specified | pH reduction below microbial growth threshold | High |
| 1 | Lactic acid | E270 | 50-21-5 | Not specified | pH reduction; membrane disruption | High |
| 1 | Rosemary extract | E392 | 20283-92-5 (carnosic acid) | Not specified (EU); GRAS (US) | Phenolic antioxidant; radical scavenging | Moderate |
| 2 — Limited Concern | Sodium benzoate | E211 | 532-32-1 | 5.0 | Inhibits anaerobic fermentation enzymes | High |
| 2 | Potassium sorbate | E202 | 24634-61-5 | 25.0 | Inhibits dehydrogenase enzymes in molds/yeasts | High |
| 2 | Calcium propionate | E282 | 4075-81-4 | Not specified | Inhibits mold enzyme systems | Moderate |
| 2 | Sulfur dioxide / Sulfites | E220-E228 | 7446-09-5 | 0.7 | SO2 disrupts disulfide bonds; enzyme inhibition | High |
| 2 | Nisin | E234 | 1414-45-5 | 1.0 | Pore formation in Gram-positive cell membranes | Moderate |
| 2 | Natamycin | E235 | 7681-93-8 | 0.3 | Binds ergosterol in fungal membranes | Moderate |
| 3 — Actively Debated | Sodium nitrite | E250 | 7632-00-0 | 0.07 | NO release inhibits C. botulinum; cured meat color fixation | High (contested) |
| 3 | Sodium nitrate | E251 | 7631-99-4 | 3.7 | Converts to nitrite in vivo; same antimicrobial pathway | High (contested) |
| 3 | Propyl gallate | E310 | 121-79-9 | 0.5 | Phenolic radical scavenging in fats | Low |
| 4 — Restricted | BHA (butylated hydroxyanisole) | E320 | 25013-16-5 | 1.0 (EFSA) / 0.5 (JECFA) | Phenolic chain-breaking antioxidant in lipids | Moderate (concerns) |
| 4 | BHT (butylated hydroxytoluene) | E321 | 128-37-0 | 0.25 (EFSA) / 0.3 (JECFA) | Phenolic chain-breaking antioxidant in lipids | Moderate (concerns) |
| 4 | TBHQ (tert-butylhydroquinone) | — | 1948-33-0 | 0.7 | Donates hydrogen to lipid peroxyl radicals | Low |
Preservative effectiveness by food type
Not every preservative works in every food matrix. pH, water activity, fat content, and target organisms determine which preservative is appropriate:
| Food Type | Primary Spoilage Threat | Most Effective Preservatives | Ineffective Choices | Typical Max Concentration |
|---|---|---|---|---|
| Acidic beverages (pH <4.5) | Yeasts, molds | Sodium benzoate (E211), potassium sorbate (E202) | Nitrites (wrong target) | 150-250 mg/kg |
| Neutral beverages (pH >4.5) | Bacteria, yeasts | Nisin (E234), sulfites (E220) | Benzoate (inactive above pH 4.5) | 200-500 mg/kg |
| Bread and bakery | Molds (Rhizopus, Penicillium) | Calcium propionate (E282), sorbic acid (E200) | BHA/BHT (antioxidants, not antimicrobials) | 2000-3000 mg/kg |
| Cured meats | C. botulinum, Listeria | Sodium nitrite (E250), nisin (E234) | Sorbate (insufficient spectrum) | 80-150 mg/kg (nitrite) |
| Cheese | Molds, surface bacteria | Natamycin (E235), sorbic acid (E200) | Benzoate (pH too high) | 1-5 mg/dm2 (surface) |
| Cooking oils and fats | Lipid oxidation (rancidity) | BHA (E320), BHT (E321), TBHQ, tocopherols (E306) | Benzoate (not an antioxidant) | 100-200 mg/kg |
| Dried fruit | Browning, molds | Sulfur dioxide (E220) | Nitrites (wrong application) | 500-2000 mg/kg |
| Wine | Oxidation, wild yeasts, Acetobacter | Sulfites (E220-E228), sorbic acid (E200) | Propionate (wrong matrix) | 150-400 mg/L (total SO2) |
| Fermented vegetables | Undesirable bacteria during fermentation | Lactic acid (E270), acetic acid (E260) | Synthetic preservatives (inhibit desired fermentation) | Self-generated |
The nitrite question — nuance that headlines miss
Sodium nitrite (E250) is the most polarizing preservative in food science. The IARC classification of processed meat as Group 1 carcinogenic is frequently attributed to nitrite, but the mechanism is more specific: nitrite reacts with secondary amines under high heat to form N-nitroso compounds (NOCs), which are the actual carcinogens.
Three facts complicate the simple “nitrite is dangerous” narrative:
First, approximately 80% of dietary nitrate (which converts to nitrite) comes from vegetables — particularly beetroot, spinach, celery, and lettuce. A serving of spinach contains more nitrate than 467 hot dogs. The vegetable matrix appears protective because co-occurring vitamin C and polyphenols inhibit nitrosamine formation.
Second, nitrite serves a critical food safety function. It prevents Clostridium botulinum growth — the botulism organism. Removing nitrite from cured meats without an equivalent antimicrobial replacement increases the risk of a foodborne illness with a 5-10% fatality rate.
Third, the “uncured” or “no nitrite added” labels on products like natural hot dogs are misleading. These products use celery powder or cherry powder as nitrite sources. Celery-derived nitrite is chemically identical to synthetic sodium nitrite. Studies show “naturally cured” products sometimes contain higher nitrite levels than conventionally cured equivalents.
The evidence-based position: the concern is real but specific to high-temperature cooking of processed meat (grilling, frying), where nitrosamine formation peaks. Boiling or steaming cured meats produces significantly fewer NOCs.
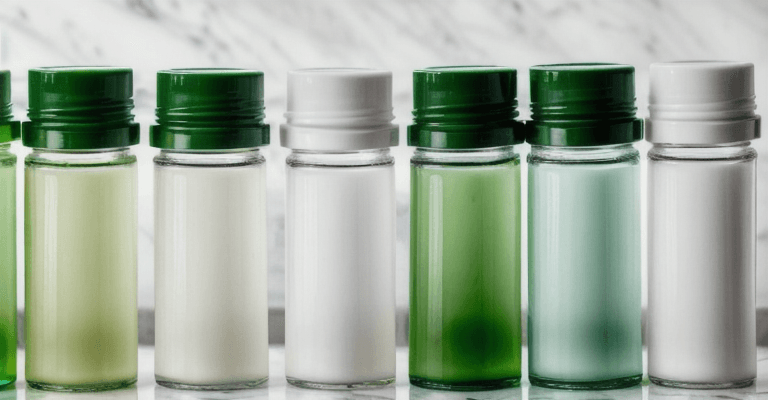
Natural vs synthetic preservatives — honest comparison
The “natural preservative” market is projected at USD 3.1 billion by 2027. The marketing implies natural preservatives are safer. The evidence does not consistently support this assumption.
| Attribute | Natural Preservatives (rosemary, citrus extract, vinegar, nisin) | Synthetic Preservatives (BHA, BHT, sodium benzoate, sorbate) |
|---|---|---|
| Regulatory safety data | Less extensive (shorter history of formal evaluation) | More extensive (decades of ADI studies, re-evaluations) |
| Antimicrobial spectrum | Generally narrower; organism-specific | Broader; effective against multiple spoilage types |
| Concentration required | Typically 2-10x higher for equivalent effect | Lower effective concentrations |
| Consistency batch-to-batch | Variable (depends on plant source, extraction method) | Highly consistent (synthetic purity >99%) |
| Flavor impact | Often significant (rosemary taste, vinegar acidity) | Minimal at effective concentrations |
| Cost | 3-15x more expensive per kg | Low cost, commodity chemicals |
| Shelf life extension | Moderate (days to weeks shorter than synthetic equivalents) | Superior (months of additional shelf life) |
| Consumer perception | Positive (“clean label”) | Negative (despite equivalent or better safety data) |
The uncomfortable truth: calcium propionate (E282) — a synthetic preservative — is chemically identical to propionic acid produced naturally by Propionibacterium during Swiss cheese aging. Lactic acid (E270) sold as a preservative is produced by bacterial fermentation — the same process that generates it in yogurt. The natural/synthetic distinction is a marketing category, not a safety category.
Where natural preservatives genuinely excel: rosemary extract (E392) and tocopherols (E306-E309) are effective lipid antioxidants with strong safety profiles. They are replacing BHA and BHT in many reformulated products not because they are “natural” but because they work comparably and carry no IARC classification.
EU vs US vs Singapore — regulatory status comparison
| Preservative | E-Number | EU (EFSA) | US (FDA) | Singapore (SFA) | Maximum Permitted Level (EU) |
|---|---|---|---|---|---|
| Sodium benzoate | E211 | Authorized | GRAS | Permitted | 150-2000 mg/kg (food dependent) |
| Potassium sorbate | E202 | Authorized | GRAS | Permitted | 300-2000 mg/kg |
| Sodium nitrite | E250 | Authorized (restricted) | Approved (restricted) | Permitted (restricted) | 150 mg/kg (ingoing) |
| Sulfites | E220-E228 | Authorized (labeling >10 mg/kg) | GRAS (labeling >10 ppm) | Permitted (labeling required) | 50-2000 mg/kg |
| BHA | E320 | Authorized | GRAS | Permitted | 200 mg/kg fat |
| BHT | E321 | Authorized (lower ADI) | GRAS | Permitted | 100 mg/kg fat |
| TBHQ | — | Authorized (limited use) | Approved | Permitted | 200 mg/kg fat |
| Nisin | E234 | Authorized | GRAS | Permitted | 3-12.5 mg/kg |
| Natamycin | E235 | Authorized (surface treatment only) | Approved (cheese) | Permitted | 1 mg/dm2 surface |
| Propyl gallate | E310 | Authorized (under review) | GRAS | Permitted | 200 mg/kg fat |
| Calcium propionate | E282 | Authorized | GRAS | Permitted | 3000 mg/kg (bread) |
| Rosemary extract | E392 | Authorized | GRAS | Permitted | 100-400 mg/kg (as carnosic acid) |
The EU and US share a fundamental structural difference: the EU requires pre-market authorization and periodic re-evaluation (Regulation EC 1333/2008). The FDA allows manufacturer self-determination of GRAS status without mandatory notification. BHA carries a GRAS designation from 1958 that has never been formally revoked, despite IARC Group 2B classification in 1986.
Singapore’s SFA (Singapore Food Agency) generally aligns with Codex Alimentarius standards, accepting both EU and US safety assessments. The Food Regulations (Cap. 283, Rg 1) specify permitted preservatives in Schedule 7, with maximum levels aligned to Codex General Standard for Food Additives (GSFA). Singapore is notable for stricter enforcement of labeling requirements than many ASEAN neighbors.
Practical exposure analysis — can you reach the ADI?
For a 70 kg adult, here is how much of a single food you would need to consume daily to reach the ADI:
| Preservative | ADI (70 kg adult total) | Typical Concentration | Food Amount to Reach ADI | Realistic Daily Intake | % of ADI at Typical Intake |
|---|---|---|---|---|---|
| Sodium benzoate | 350 mg | 150-250 mg/kg in soft drinks | 1.4-2.3 L soft drink | 330 mL (one can) | 14-24% |
| Potassium sorbate | 1750 mg | 1000-2000 mg/kg in cheese | 875 g-1.75 kg cheese | 40 g (one slice) | 2-5% |
| Sodium nitrite | 4.9 mg | 80-150 mg/kg in cured meat | 33-61 g cured meat | 50 g (2 slices ham) | 82-152% |
| BHT | 17.5 mg | 100-200 mg/kg in cereal | 88-175 g cereal | 40 g (one bowl) | 23-46% |
| Sulfites | 49 mg | 100-300 mg/L in wine | 163-490 mL wine | 150 mL (one glass) | 31-92% |
| BHA | 70 mg | 100-200 mg/kg in chewing gum | 350-700 g gum | 3 g (one piece) | <1% |
| Calcium propionate | Not specified | 2000-3000 mg/kg in bread | — | 80 g (2 slices) | — |
Sodium nitrite stands out: its ADI can be reached or exceeded with a single serving of cured meat. Sulfites approach the ADI with moderate wine consumption. All other common preservatives require quantities far beyond normal eating patterns. This is consistent with the epidemiological data identifying processed meat and sulfite-containing beverages as specific concerns rather than preserved food in general.
Honest limitations of this analysis
Several factors complicate clean ranking of preservative safety:
Cumulative exposure is poorly studied. ADIs are set for individual compounds. A person consuming sodium benzoate in a soft drink, potassium sorbate in bread, sulfites in wine, and nitrites in lunch meat simultaneously has no combined ADI to reference. Additive toxicology — the study of mixture effects — remains underdeveloped.
The benzene formation question. Sodium benzoate (E211) can react with ascorbic acid (E300) in acidic beverages to form benzene, a known carcinogen (IARC Group 1). Levels detected in soft drinks (1-20 ppb) are below the WHO drinking water guideline of 10 ppb in most but not all samples. The FDA tested 200 soft drinks in 2006 and found 5 exceeded the 5 ppb US drinking water standard. Industry reformulation has reduced but not eliminated this issue.
Evidence gaps in newer preservatives. Natamycin (E235) and nisin (E234) have shorter regulatory histories than benzoate or sorbate. Their safety profiles look favorable but are based on fewer long-term studies. The precautionary response is not to avoid them but to note the difference in evidence depth.
Individual variation. Sulfite sensitivity affects 5-10% of asthmatic individuals. This is not captured by the population-level ADI. If you have asthma and experience bronchospasm after wine, dried fruit, or restaurant salads (sulfite-sprayed to maintain freshness), your personal threshold is lower than the ADI suggests.
The evidence does not support blanket preservative avoidance. Tier 1 and Tier 2 preservatives have safety margins so large that typical dietary exposure is a small fraction of the ADI. The actionable concerns are specific: minimize high-temperature cooking of nitrite-cured meats, monitor sulfite intake if asthmatic, and note that BHA/BHT exposure is declining as manufacturers voluntarily reformulate with tocopherols.